
Token Demand Inflection, Buildout Bottlenecks, and Relative Winners
Summary
I believe the AI infrastructure buildout is entering a phase that is structurally different from prior technology cycles, and the difference comes down to the following observation: token demand is inflecting upwards, while the supply response, although massive, is capped by key bottlenecks.
Token consumption – the fundamental unit of AI demand – has grown exponentially across three eras. Initially, chat interactions consumed ~1,000-5,000 tokens. Then, reasoning models introduced invisible "thinking tokens" that added a 5-10x token multiplier. Now, agentic AI – the current era best represented by Claude Code & Codex – consumes 50-200x more tokens per task than chat ever did. I tracked my own usage and found that five days of Claude Code usage consumed more tokens than an entire year of ChatGPT (~152M vs. ~94M). While this isn’t necessarily apples-to-apples, as Claude Code relies heavily on “cached” tokens that are much cheaper to consume, the overall magnitude indicates a step-function change in token demand.
To be clear, this dynamic is not specific to coding: the iterative, context-heavy interaction model applies to legal, finance, consulting, and other knowledge work, and the hundreds of millions of global knowledge workers dwarf the ~30 million developers who’ve adopted these tools first. Put simply, we are still in the early days of an explosion in token consumption.
On the supply side, consensus estimates call for ~87 GW of total AI data center capacity by 2028 – up from ~7 GW at the end of 2024. That is roughly 80 GW of net new capacity in four years. However, the gap between "announced" and "operating" is large and growing. Grid connection timelines run 24-72 months in most markets (although behind-the-meter power is helping to solve this bottleneck). Timelines are slipping across the board: 30-50% of the ~140 large data center projects targeting 2026 completion face delays, and a quarter of those projects haven't even disclosed a power sourcing plan. Local opposition is intensifying as communities push back on the noise, water consumption, and grid strain that multi-GW campuses bring. The construction industry faces a ~450,000-worker shortage driven specifically by data center growth. Electricians, ironworkers, and controls technicians are some of the tightest supply trades, and these same workers are being pulled in three directions by data centers, grid buildout, and manufacturing reshoring. Power transformers, which carry 2-3 year lead times, face a 30% supply deficit. Even if the power and labor materialize, silicon also acts as a governor: TSMC's advanced packaging (CoWoS) is sold out through 2026, wafer demand runs ~3x available supply, and HBM allocation is constrained through at least the same timeframe. The bottleneck is not money – hyperscaler capex is surging from ~$254B in 2024 to ~$685-720B guided for 2026. The bottleneck is that the logistics, physics, and politics of coordinating an infrastructure project of this size are difficult.
With another step-function increase in token demand colliding with an already strained infrastructure buildout, the probability that the industry remains compute-constrained for longer has risen materially. When demand accelerates faster than physical infrastructure can be deployed, economic value concentrates around the owners of the bottlenecks. In the AI stack those bottlenecks are: advanced accelerators, advanced packaging capacity, high-bandwidth memory, semiconductor manufacturing equipment, and the power and data-center infrastructure required to run it all. This dynamic changes the structure of the cycle. Rather than the rapid boom-bust dynamics typical of semiconductors, constrained supply slows the pace at which capacity can be added and extends the expansion phase. Capacity still grows aggressively, but it cannot scale fast enough to fully absorb demand in the near term. The result is a market where firms that control scarce inputs gain disproportionate leverage.
The Three Inflection Points in Token Consumption
Era 1: Chat (November 2022 – Late 2024)
For perspective, a typical enterprise query in 2020 used fewer than 200 tokens1. ChatGPT-style interactions brought that to ~1,000-5,000 tokens per exchange – a meaningful step up, but still a single request/response cycle with modest infrastructure demands.
Era 2: Reasoning (Late 2024 – Late 2025)
Models like OpenAI’s o1 introduced invisible "thinking tokens," meaning a 500-token visible response might actually consume 2,000-4,000+ total tokens (a ~5-10x overhead hidden from the end user). Reasoning models went from <5% to >50% of all token usage on OpenRouter by late 20252, and enterprise reasoning token consumption grew ~320x in 12 months per OpenAI's enterprise report. It's worth noting that this was happening largely beneath the surface – most users had no idea how many tokens their queries were actually consuming.3
Era 3: Agentic / Stateful (Mid 2025 – Now)
A single Claude Code session consumes 50,000-200,000 input tokens (and that is a moderate session). Said plainly, the jump from chat to agentic is not incremental; it is a fundamentally different workload requiring orders of magnitude more token usage.
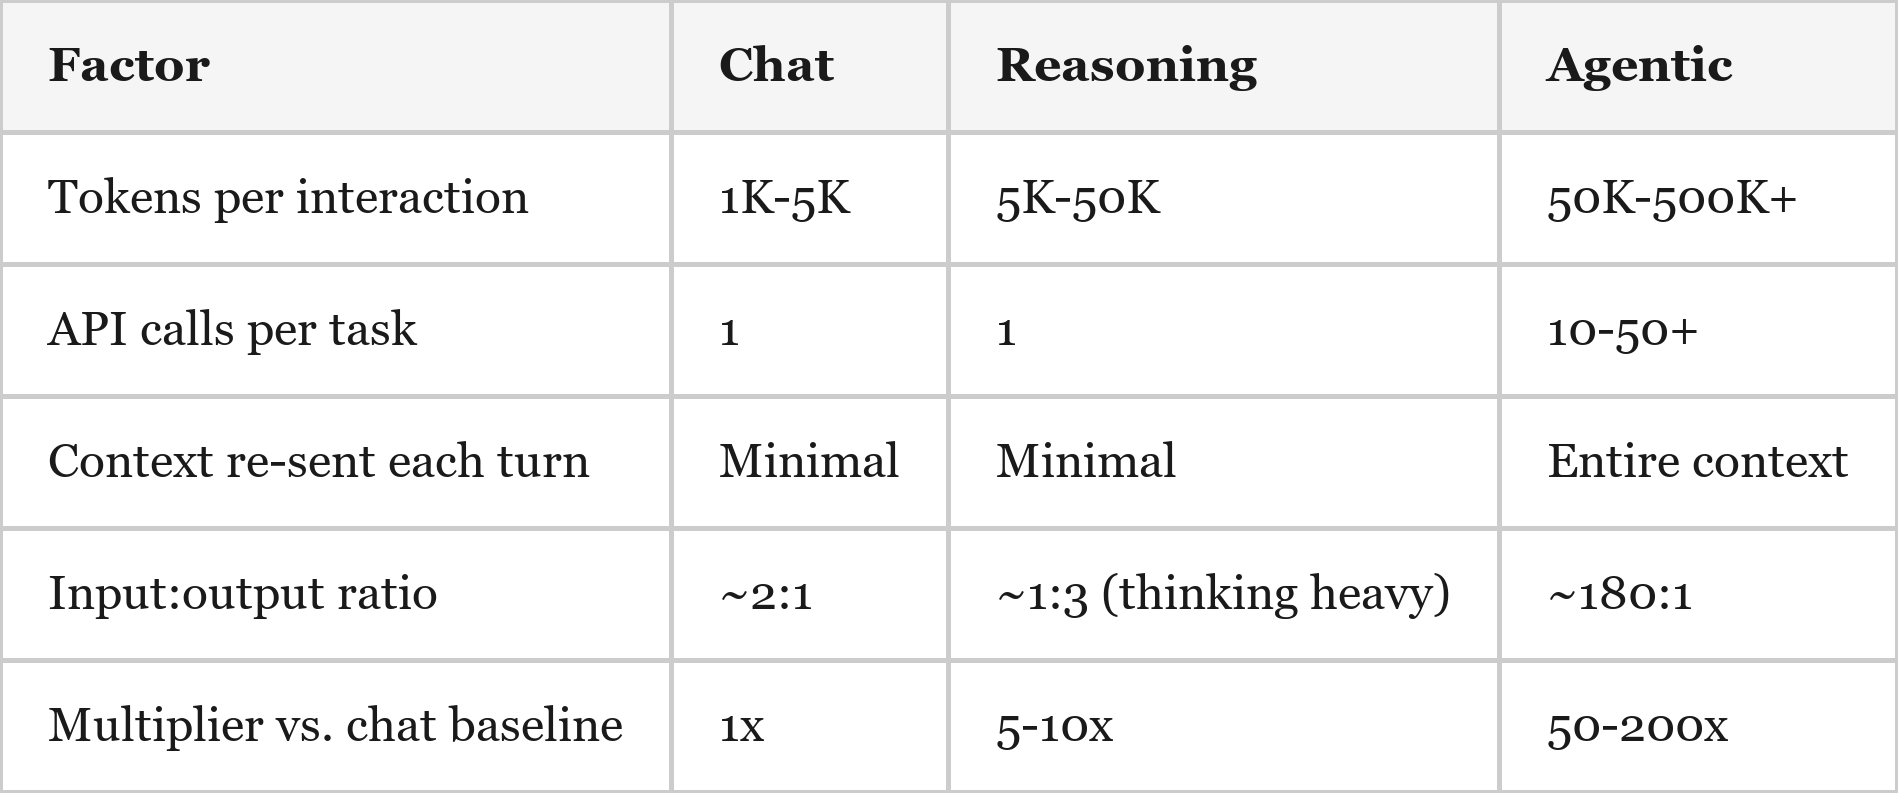
Why is agentic AI so consumptive? Every tool call – reading a file, running a search, making an edit – adds to the conversation context, and the model re-reads the full context on every turn. A single task might involve 20-50 sequential API round-trips in a “read-think-edit-verify” loop, with the context growing on each iteration. The system prompt alone can run 5,000-10,000 tokens, paid on every single turn. And files are also tokens – a 500-line source file costs ~2,000-3,000 tokens, so a session that reads 20 files burns through 40,000-60,000 tokens on file contents alone before any reasoning even begins!
The Demand Multiplier – Agentic AI Beyond Coding
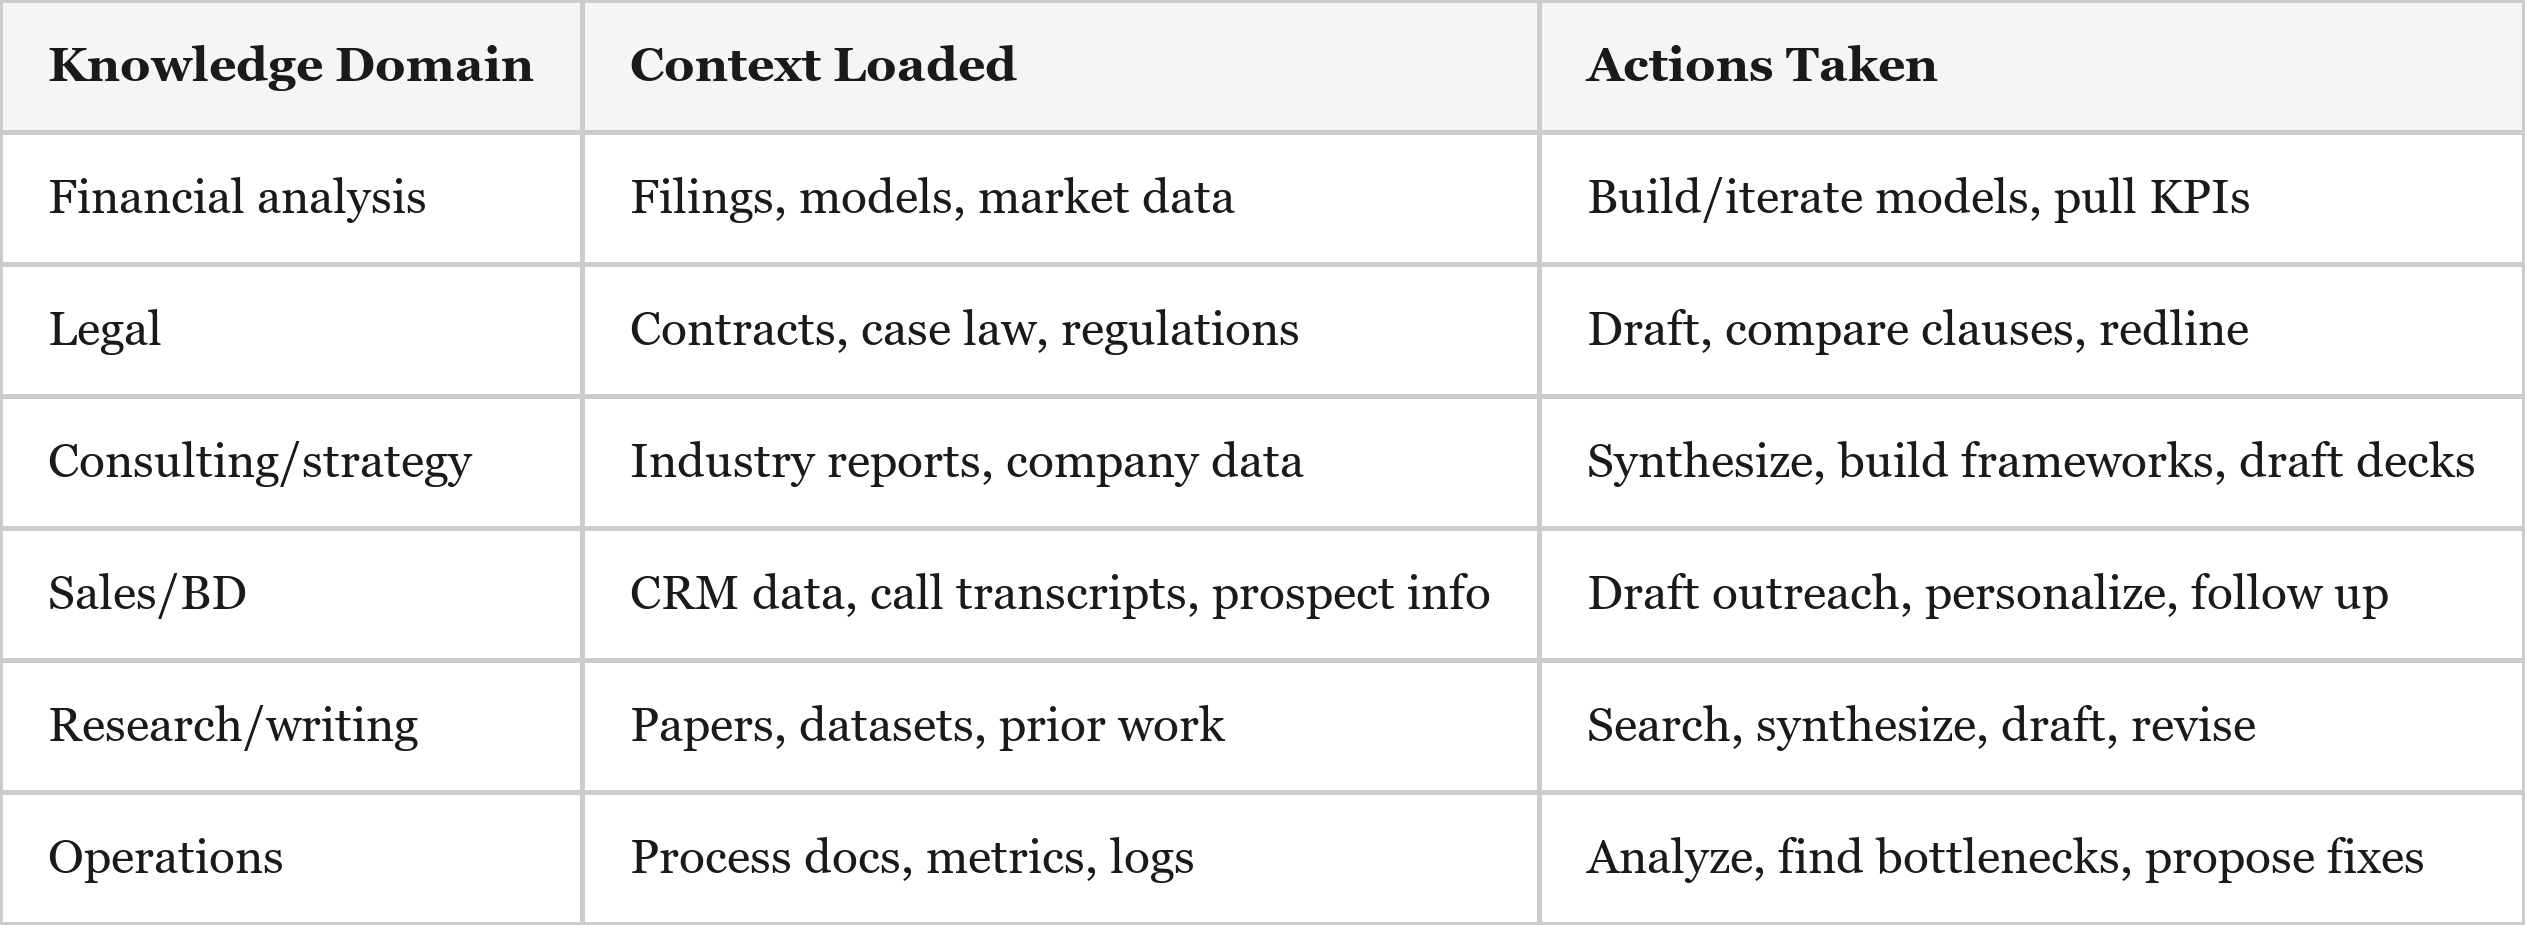
It’s worth highlighting that the interaction pattern which makes Claude Code/Codex so token-intensive is not specific to writing software. There is a general pattern that is useful for all knowledge workers: iterative, context-heavy, tool-using AI assistance. The core loop is straightforward – load large context (files, documents, data), reason over it, take an action (edit, search, compute), evaluate the result, and repeat. Each step consumes tokens, and a single task may loop 10-50 times, multiplying consumption.
Application Across Knowledge Work
Why This Drives Higher Token Consumption (a.k.a. ARPU)
Knowledge workers outnumber software developers by an order of magnitude (~30M developers globally vs. ~700M+ knowledge workers4). If even 20% adopt agentic tools, the user base multiplies dramatically. And business documents are longer than code – a 50-page contract, a 200-page 10-K, or a full CRM history contains far more tokens than a typical codebase interaction, which means the context-loading step is actually more expensive for knowledge work than for software engineering. Additionally, less structured work means more iteration. Code has clear success criteria – it compiles, tests pass. A strategy memo or legal brief requires more subjective refinement ("make this sharper," "add the competitive angle," "cross-reference against the prior agreement"). More loops = more tokens.
The willingness to pay should be material. In most knowledge industries, labor costs dwarf compute costs. A lawyer billing $500/hour who saves two hours reviewing a contract has created $1,000 of value and would gladly spend $50–$100 in tokens to get it. A junior investment analyst who can build a full model in 30 minutes instead of two days has effectively multiplied their productivity severalfold. When the marginal input (compute) costs dollars and the displaced input (skilled labor) costs hundreds of dollars per hour, the equilibrium outcome is straightforward: organizations should spend aggressively on compute until the productivity gains are fully arbitraged. On a personal level, I would happily pay $10–20K per year for Claude Code because it meaningfully increases my output – an easy decision relative to the value of my time.
Case Study: My Personal Claude Code vs. ChatGPT Usage – Actual Data
To illustrate this era shift, I compared my own usage across two tools. My Claude Code data comes from the “ccusage” CLI, which reads actual Anthropic API token counts and cost from local session logs (5 days, March 2-6 2026). My ChatGPT data comes from an OpenAI data export covering all of my 2025 conversations (2,767 conversations), with tokens counted using OpenAI's tiktoken encoder on the exported conversation text, plus estimates for content stripped from the export (system prompts, reasoning tokens, conversation history resending). While I have paid subscriptions with both OpenAI and Anthropic, I used API pricing for the sake of comparison.
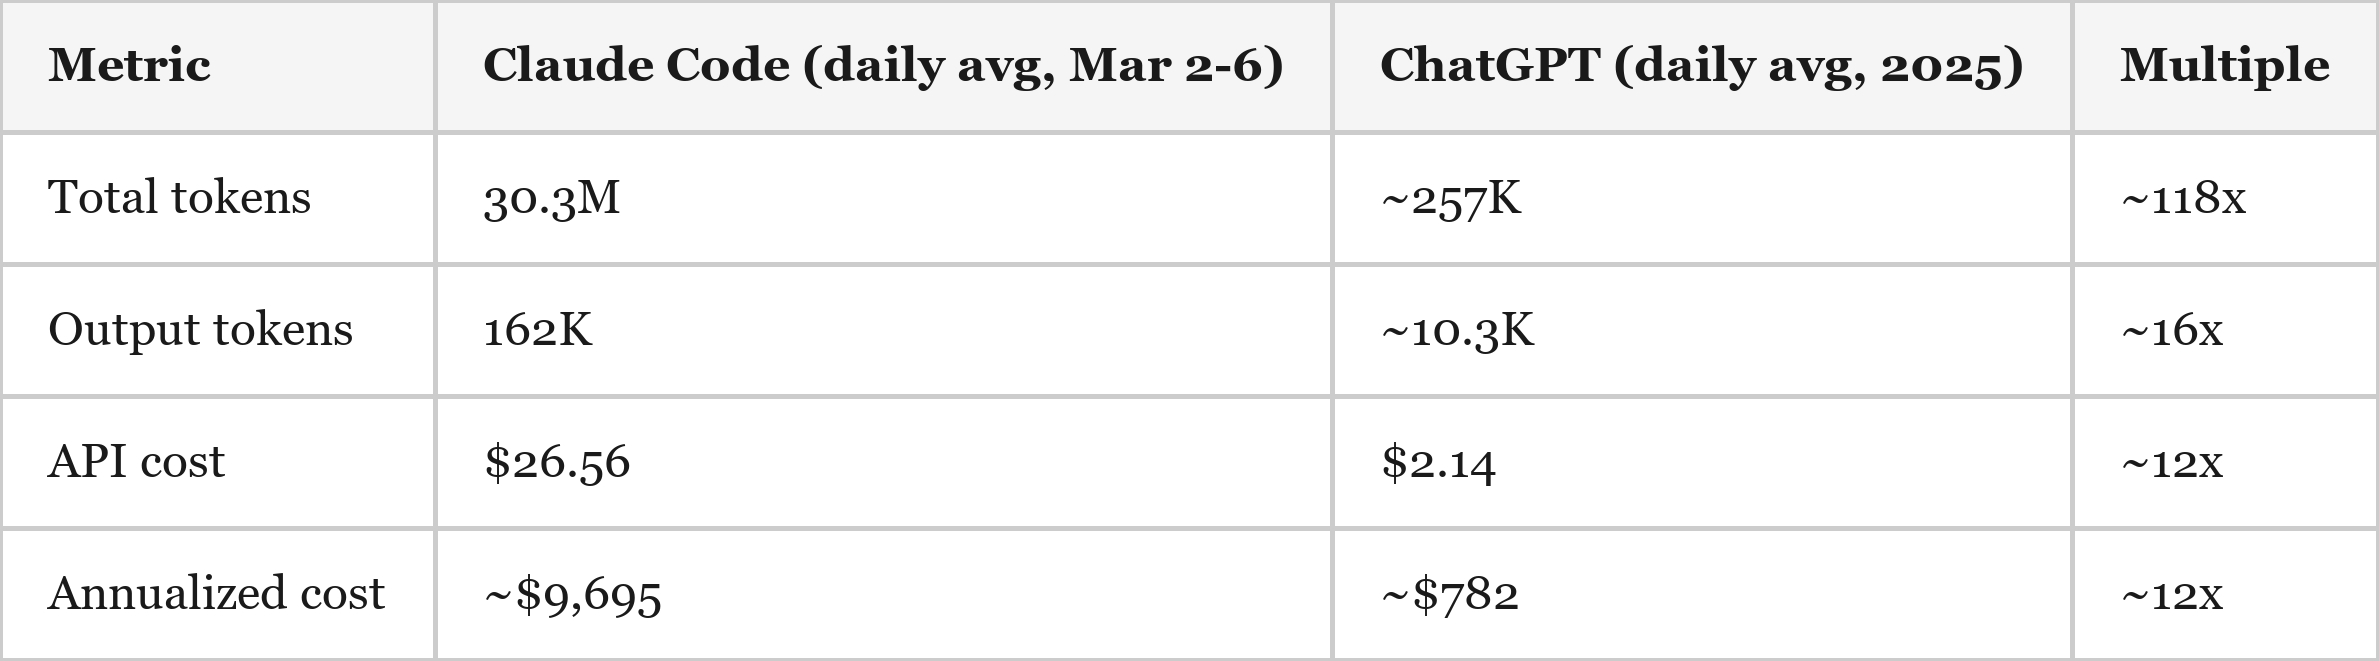
On a daily basis, Claude Code consumed ~118x more total tokens, generated ~16x more output tokens, and incurred ~12x higher API cost than ChatGPT averaged per day over 2025.
A note on cost comparability
These two tools price very differently, and the distinction matters. ChatGPT's cost is dominated by reasoning tokens – invisible chain-of-thought that models like o1 and o3 generate behind the scenes, billed at the output rate. o1-pro charges $600 per million output tokens5, making it the most expensive model in the industry; just 32 conversations on o1-pro accounted for 42% of my entire ChatGPT annual bill (if converted to API pricing). Reasoning tokens across all thinking models drove another 57%. The text I actually read (output tokens) contributed less than $100 of the estimated $782 total spend.
Claude Code's cost structure is the inverse. Volume is enormous – 152M tokens in five days – but ~94% of those tokens are cache reads, priced at $0.50 per million tokens for Opus6. The actual output (code written, explanations generated) was only 810K tokens, or 0.5% of volume. It is a high-volume, low-unit-cost workload.
The upshot: raw token counts and per-token pricing are not apples-to-apples across these two tools. The annualized cost comparison – ~$9,700 for Claude Code vs. ~$782 for ChatGPT at base-case assumptions – is probably the cleanest single metric, because it captures the net effect of both pricing structure and usage intensity in one number.
Sensitivity
The CC-to-ChatGPT cost ratio of ~12x is sensitive to my “reasoning token” estimates for ChatGPT, which are the largest single uncertainty – as these tokens were hidden and did not show up in my ChatGPT conversation export. Therefore, I was forced to make estimates based on market standard ratios of input & output tokens (which the export contained) vs. reasoning tokens (which the export did not contain) for each different OpenAI model (high multipliers applied to o1 and o3).
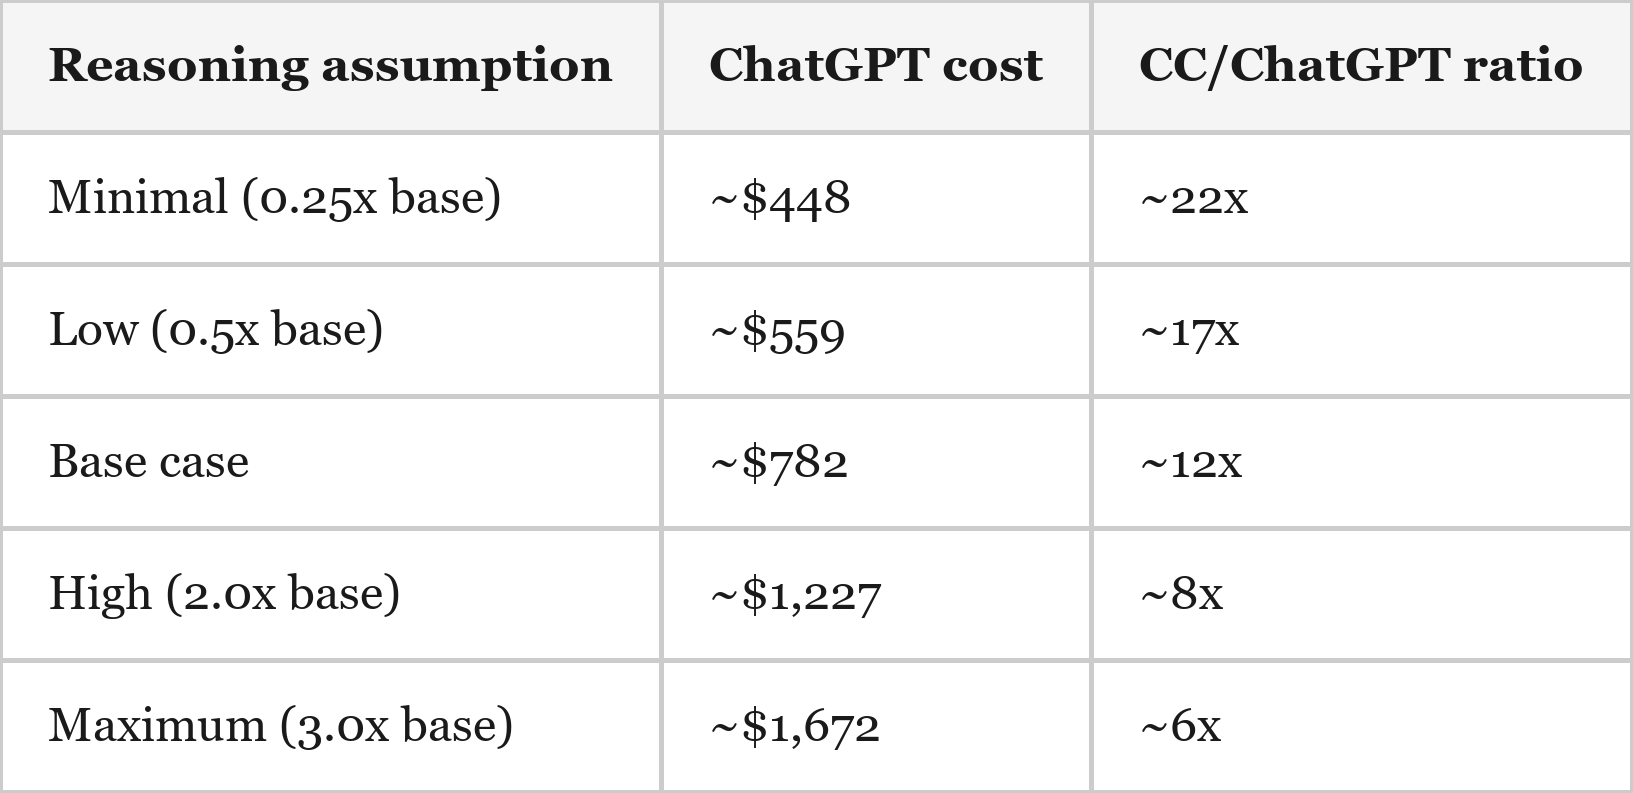
My best estimate is that API-priced usage has increased roughly 6–22x, with a base case of about 12x. This range may still prove conservative. Models like o1 and o3 appear to have been priced at a premium in part to ration demand, while Anthropic currently seems to be pricing tokens aggressively to drive adoption. Although the comparison relies on estimates of total token consumption for ChatGPT, the core takeaway is reinforced by the most directly observable metric shared across both datasets: output tokens, which are running roughly 16x higher in Claude Code than in ChatGPT.
The purpose of this example is not to estimate global demand from a single user, but to illustrate how quickly token consumption can scale once AI systems move from chat queries to persistent, agentic workflows embedded inside knowledge work tasks.
The implication for infrastructure
The more important takeaway is the intensity of agentic workloads. In my own usage, agentic tools have consumed roughly 12x the annual API cost of my prior chat-based usage. This is likely a relatively early and moderate example. Power users running multiple concurrent agents are likely pushing 10-50x higher compute consumption.
Importantly, this usage appears to be largely incremental (rather than substitutive). My chat-based usage has not fallen to zero; I now use both workflows. Claude Code usage appears mostly additive rather than replacing ChatGPT, and I also use Claude for Excel – another token-intensive agentic workflow that is not included in the figures above.
Observable API Spend
Weekly AI API spend tracked by Yipit7 shows a ~5x increase from early 2025 to early 2026.
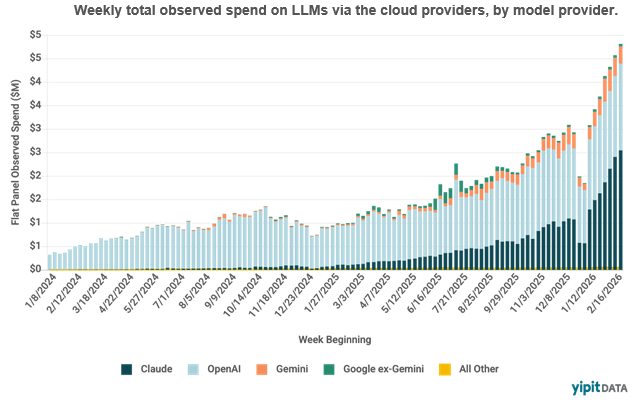
It's worth noting that Claude (Anthropic) has become the single largest contributor to observable API spend, consistent with its ~$20B ARR trajectory8 and rapid agentic coding adoption. The growth inflects sharply in late-2025 – aligning with the shift from reasoning to agentic workloads. OpenAI spend is relatively flat in recent quarters despite usage growth, which I estimate reflects price cuts offsetting volume gains. Gemini is growing but from a small base. Ultimately, the ~10x growth in weekly spend over two years is a real-dollar confirmation of the token consumption thesis, and since prices have fallen significantly over this period, the underlying token volume growth is far greater than the spend growth implies.
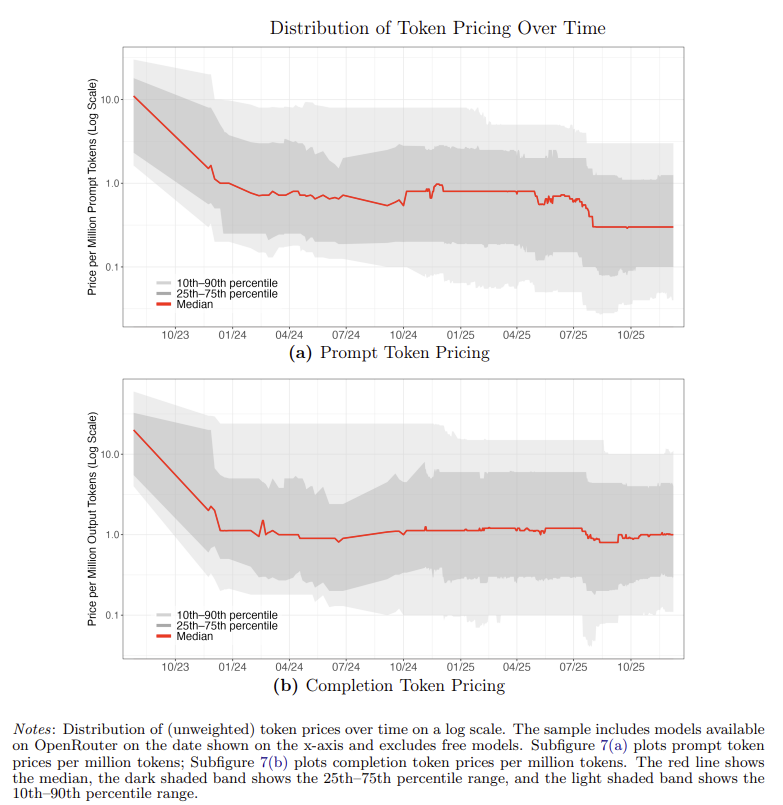
Token Pricing vs. Volume
OpenRouter data reveals the “token” side of the spend story – token usage is exploding, cost per token (excluding prompt caching) has remained roughly constant over the last ~6 months, and the total cost per token is declining as cached tokens constitute a growing share of the total token usage.
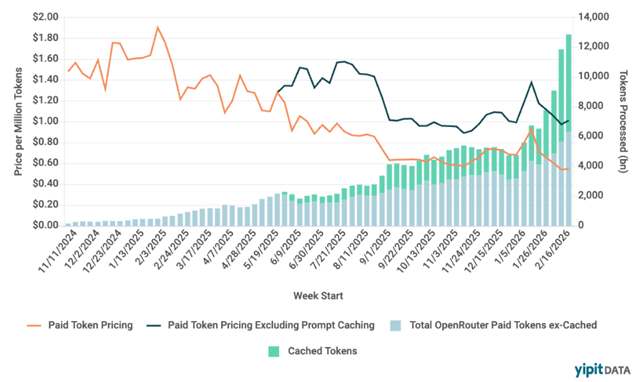
The price per million tokens has fallen roughly 70%, from ~$1.60 to ~$0.50, in just 15 months. Over the same period, volume has grown 10-13x, with paid tokens (ex-cached) rising from ~800 billion to ~10,000 billion per week. Prompt caching has exploded from negligible to ~4,000-5,000 billion tokens per week by Q1 2026 – roughly half of total volume. This is a direct signature of agentic workloads, which repeatedly re-send the same large context on every turn.
The price decline masks the volume explosion. Spend grew ~10x, but because prices fell ~70%, the underlying token volume grew far more – roughly 10-13x in paid tokens alone, and significantly more when including cached tokens. This is textbook Jevons paradox in real time: as tokens get cheaper, usage grows because cheaper tokens make new use cases viable. Agentic loops that would have been cost-prohibitive at $1.50 per million tokens are justified at $0.25.
Revenue Confirmation
The revenue data confirms what the token data implies – and the pace is accelerating faster than even the companies themselves expected. In October 2025, Anthropic was targeting $9B in ARR by year-end9. They hit it. By February the run-rate was ~$14B10; as of early March, Bloomberg reports it is approaching ~$20B11. That is roughly 20x growth in 14 months from the ~$1B run rate in December 202412, with Claude Code as a major driver.
Sizing the Buildout – Supply Side
Below I attempt to size the amount of effective compute capacity (as measured in the supply of tokens) coming online by taking into account consensus AI datacenter buildout estimates, generation-over-generation GPU improvements in compute & bandwidth (per unit of power), and an estimate of a “model efficiency factor” which is meant to account for the offsetting phenomenon of each particular model generation getting cheaper to run over time vs. our “cognitive greed” (the propensity to consistently upgrade to more expensive frontier models).
The goal is to estimate how much compute (as measured in FLOPS) and bandwidth capacity (as measured in B/s) will come online in the coming years. To be clear, this below analysis involves numerous assumptions, but I’ve attempted to be fairly aggressive in assumptions regarding buildout timelines, chip efficiency gains, and model efficiency gains – all in an attempt to be directionally informed as to just how much effective capacity could be coming online over the next few years.
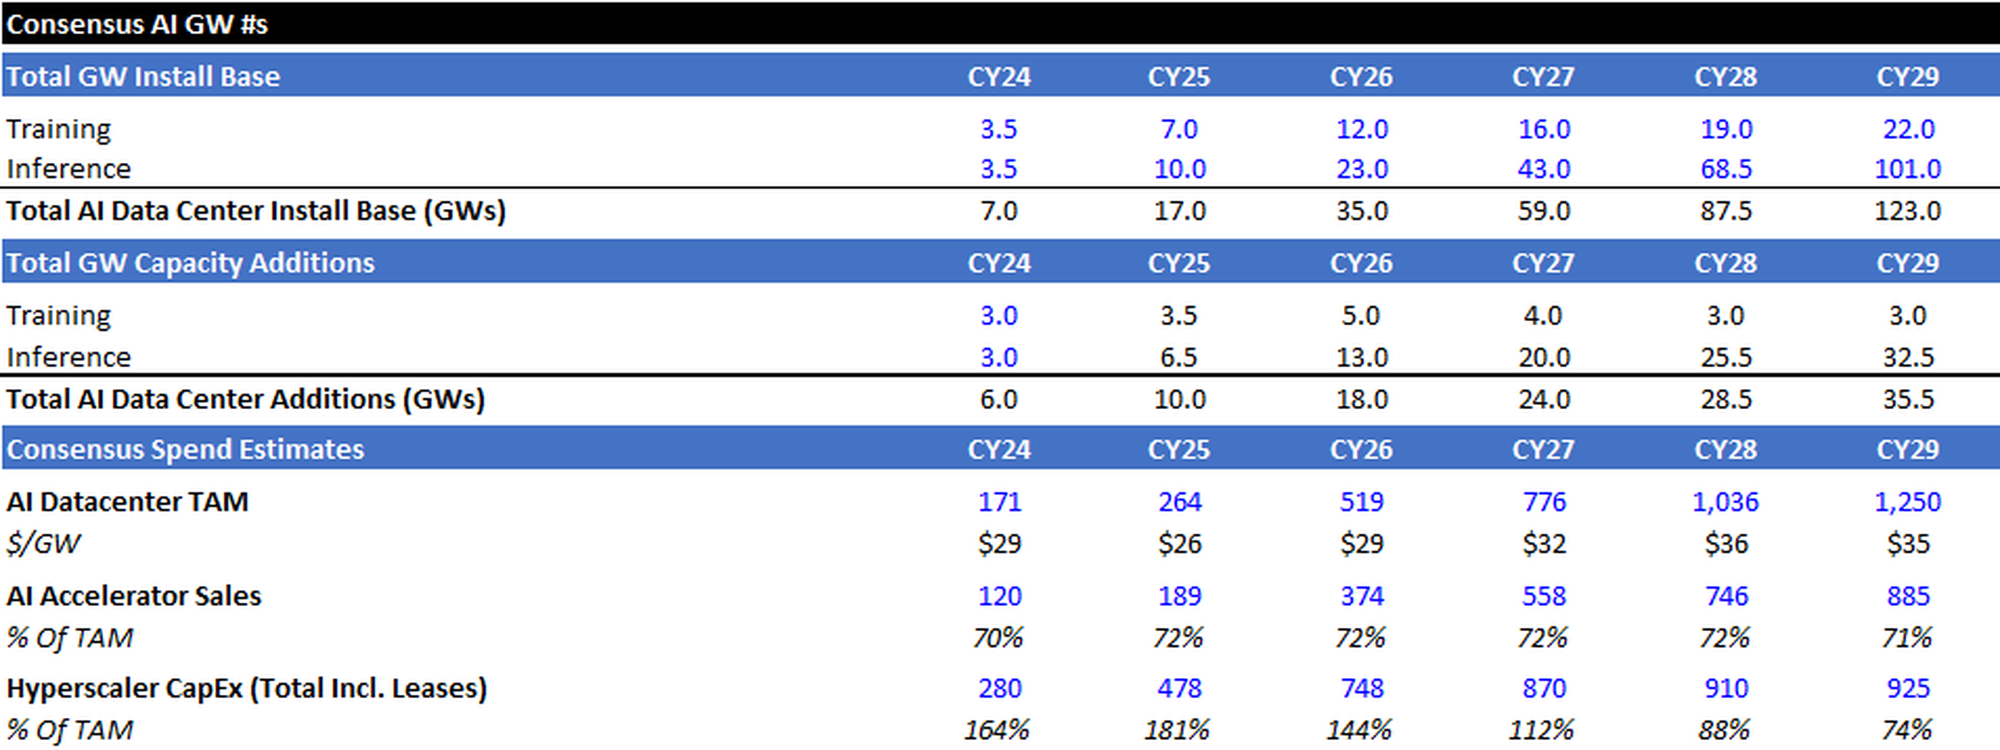
Consensus Capacity Estimate
Consensus calls for capacity additions to roughly equal:
- 18GW in 2026 (vs. 6GW/10GW in 2024/2025)
- 24 GW in 2027
- 28 GW in 2028
- 34 GW in 2029
I estimate the majority of incremental capacity additions will go to serving inference workloads. I’ve also highlighted consensus AI Datacenter TAM (Accelerators + Building Envelope), AI Accelerator Sales, and Hyperscaler CapEx for reference.
Chip Efficiency Gains
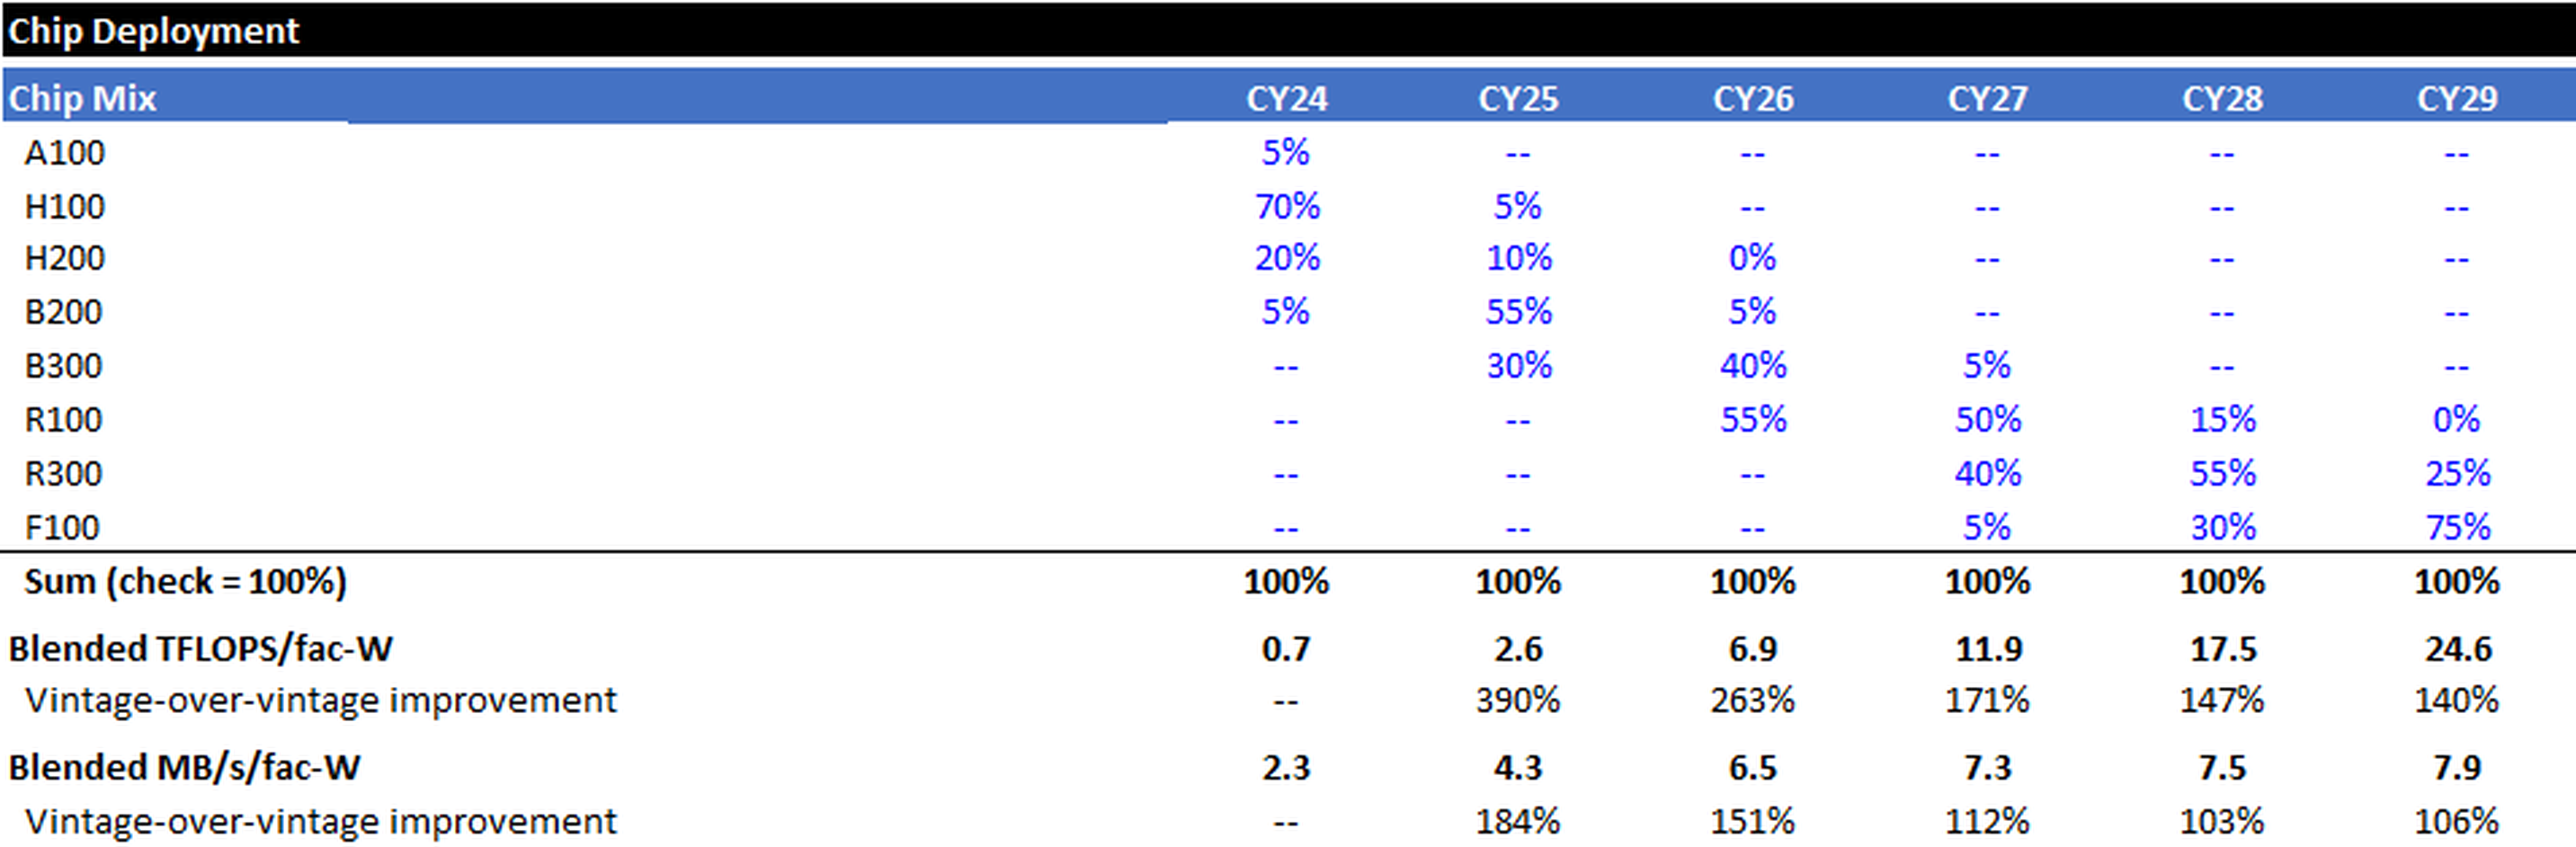
Each incremental generation of Nvidia chips provides more compute (FLOPS) and bandwidth (TB/s) per unit of power (watt). While metrics for the A100 through R100 are knowable, I’ve used estimates at the upper end of the rumored range (from an efficiency perspective) for the subsequent generations.
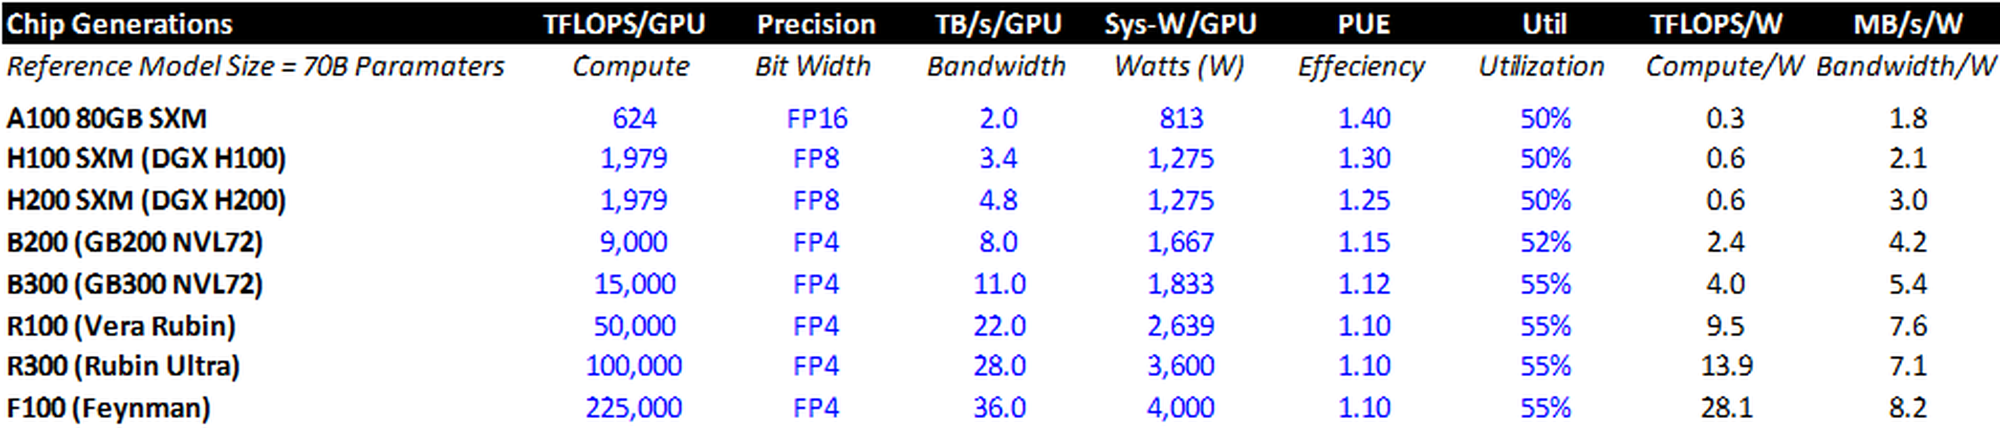
Fleet Mix
I assume that the entire global fleet of AI Accelerators is NVIDIA based (simplifying assumption), and assume aggressive rollouts for NVIDIA’s upcoming chip generations. I can then compute a blended TFLOPS/facility-watt (compute) and Blended MB/s/facility-watt (bandwidth) estimate for each calendar year’s cohort.
For example, in 2026 I assume that ~5% of the chips installed that year are B200s, 40% are B300s, and 55% are R100s. Therefore, the blended TFLOPS/facility-watt and MB/s/facility-watt for 2026 are higher than the B200, but lower than the R100, standalone.
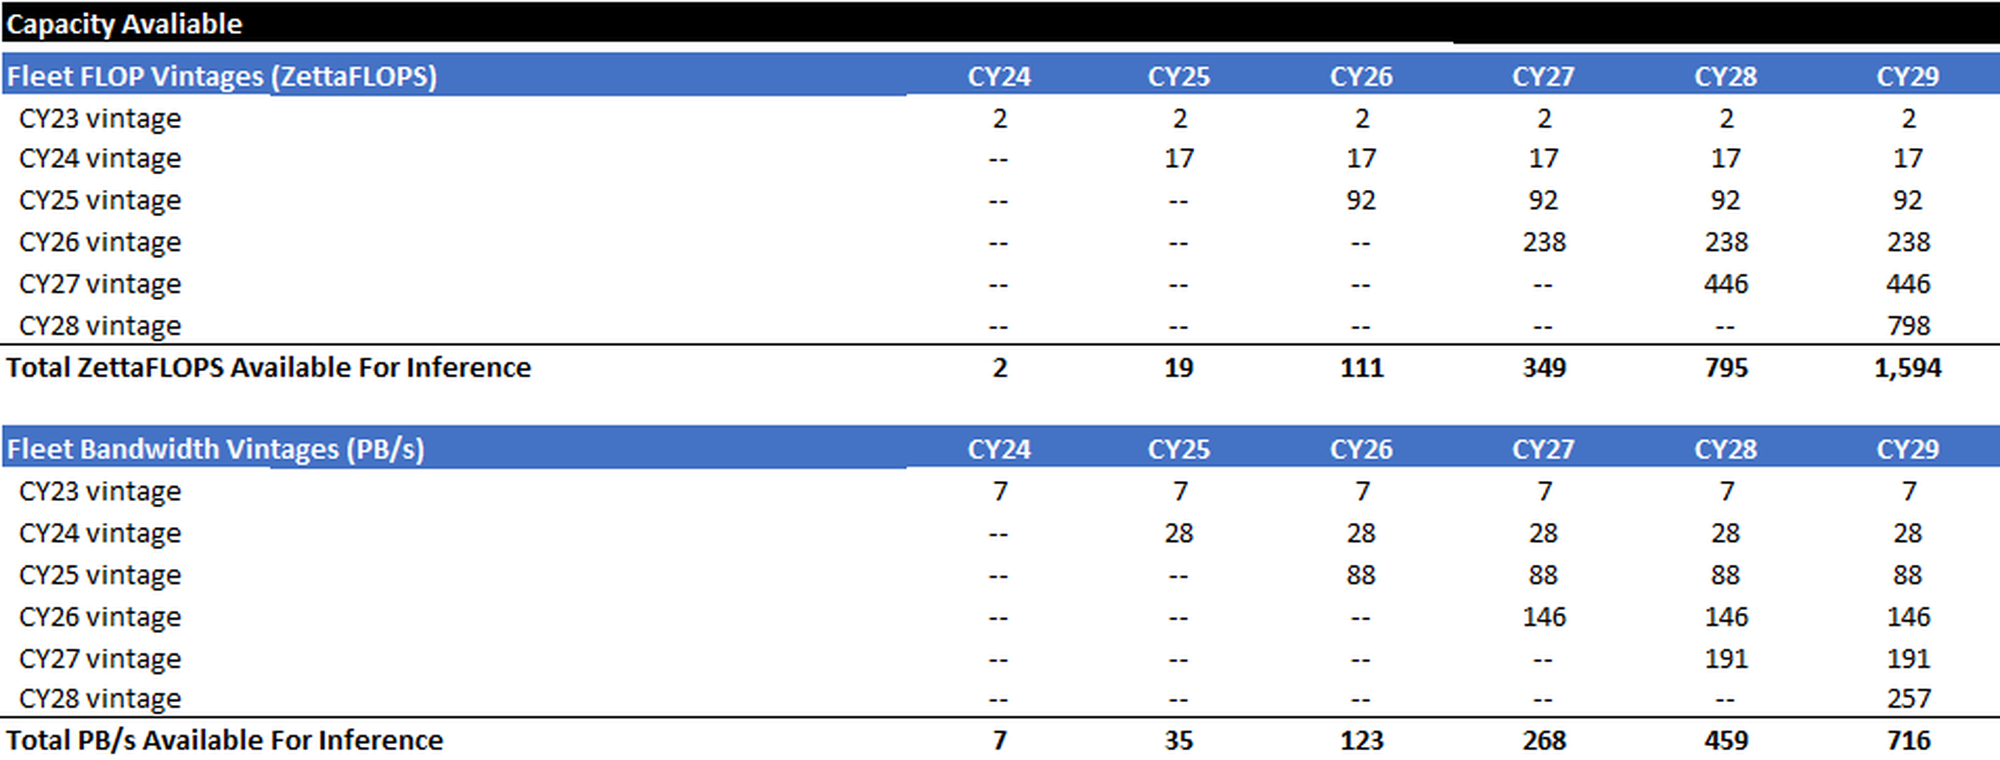
Cohort Stacking
The following is simple math – multiply the inference GWs installed each calendar year by the blended compute and bandwidth metrics for each calendar year. The result is a stacking of inference compute cohorts and an estimate of the total global compute and bandwidth capacity available during each calendar year.
Model Efficiency Factor
All of the math above is pretty straightforward. One person may think ASICs will prove more efficient, and another may feel that the pace at which I assume the latest and greatest Nvidia chips get installed is aggressive – but the “error bands” should be relatively tight.
However, the hardware capacity tables above only measure “raw” compute (FLOPS) and bandwidth (B/s) per watt. But “raw” hardware capability is not the same as useful token output. A watt of inference capacity in 2029 may produce more or fewer useful tokens per second than a watt in 2025, depending on two supply-side dynamics that operate independently of the hardware roadmap.
The first is inference efficiency: software, algorithmic, and serving-stack improvements that allow the same chip to produce more tokens per second. For example, GPT-4 level models have gotten much more efficient to run over time.
The second is model complexity migration: as users shift to larger, more capable frontier models, each token requires more FLOPS and more memory bandwidth, reducing the token throughput of a given chip. For example, relatively few users now primarily rely on GPT-4 class models; usage has largely migrated to more compute-intensive frontier models.
The Model Efficiency Factor (MEF) is the net of these two forces, applied as a multiplier to the raw hardware capacity calculated above.
Inference Efficiency Gains (Incremental to the Hardware Roadmap)
Several software and architectural techniques increase token throughput per watt independently of chip improvements: MoE sparsity improvements (activating a smaller fraction of model parameters), KV-cache compression (reducing the memory bandwidth consumed by attention), speculative decoding (using a small model to draft tokens that a large model verifies in parallel), prefill/decode disaggregation (routing compute-bound and bandwidth-bound workloads to separately optimized hardware), improvements in the utilization of the memory hierarchy (larger on-chip SRAM, better caching and dataflow scheduling that reduce traffic to HBM), and serving-stack improvements (better batching, scheduling, and memory management). Each of these techniques offers incremental throughput gains on the order of 1.2–2x individually. They are multiplicative in theory but interact in practice – KV-cache compression may change the math on speculative decoding, disaggregation changes batching dynamics, improved cache locality reduces pressure on HBM bandwidth, and so on – and many are already partially deployed at scale. A reasonable range for cumulative software & architecture-driven efficiency gains, incremental to the current baseline, is 3-8x by 2029. The range is deliberately wide: the low end assumes most low-hanging fruit is already picked and interaction effects limit compounding; the high end assumes that disaggregation, deeper sparsity, and better exploitation of the memory hierarchy deliver on their theoretical potential. A genuine architectural breakthrough – sub-quadratic attention becoming standard, or processing-in-memory reaching production – would push the number higher, but discontinuous breakthroughs are not the base case.
Model Complexity Migration (the Offset)
Working against these efficiency gains is the observed tendency of users to migrate toward more powerful and more compute-intensive frontier models. A fleet serving a 200B-parameter model produces fewer tokens per second than the same fleet serving a 70B-parameter model.
The trend is clearly toward larger active compute footprints: longer internal reasoning chains, more complex attention patterns, and richer multimodal encoders all increase FLOPS and bandwidth per output token. The effective compute penalty from model migration is difficult to estimate precisely, but a range of 2-5x by 2029 captures the plausible outcomes — the low end reflecting a world where MoE keeps active compute manageable, the high end reflecting aggressive scaling of frontier model complexity.
What the Market Data Shows
If I lost you with the above discussion of “inference efficiency gains” vs. “model complexity migration,” hang with me, because we are about to make a data-backed simplifying assumption.
An NBER working paper by Fradkin et al.13, using OpenRouter transaction data, provides the most direct evidence on how these two forces have netted out. The key finding: while prompt token pricing has fallen ~70%, output token pricing has been roughly flat since mid-2024.
Output token pricing is the right metric because it reflects the cost to produce a token on existing hardware – which is exactly what the MEF measures. Flat output pricing, despite meaningful inference optimization over this period, implies that model complexity migration has consumed the efficiency gains approximately one-for-one. The same GPU produces roughly the same economic value of output tokens today as it did a year ago, even though the software stack has improved materially. This is consistent with a base-case MEF near 1.0x, and it is an empirical observation to date.
MEF Scenarios
The base case assumes a net MEF of ~1.0x, meaning software efficiency gains and model complexity migration roughly offset one another (our simplifying assumption), broadly consistent with the past ~18 months of observed market behavior. While this period is admittedly short, it suggests that improvements in model efficiency have historically been accompanied by users migrating toward more compute-intensive frontier models, leaving effective compute demand largely unchanged on a per-token basis.
The upside case requires inference optimization to compound faster than model complexity grows. This is plausible, but not yet observable in the data. If the cumulative efficiency gains land toward the high end of the 3-8x range, while other advancements keep model migration offsets toward the low end of 2-5x, the net MEF could reach 2-3x by 2029. I use 2.5x as the upside scenario – not because I have high confidence in the specific number, but because it represents a reasonable upper range given the current trajectory without assuming some discontinuous breakthrough.

Multiples vs. 2025
Ultimately, these adjustment factors produce scenarios where the total amount of compute available increases ~80-200x between 2025 and 2029, while bandwidth only increases 20-50x (the bottleneck).
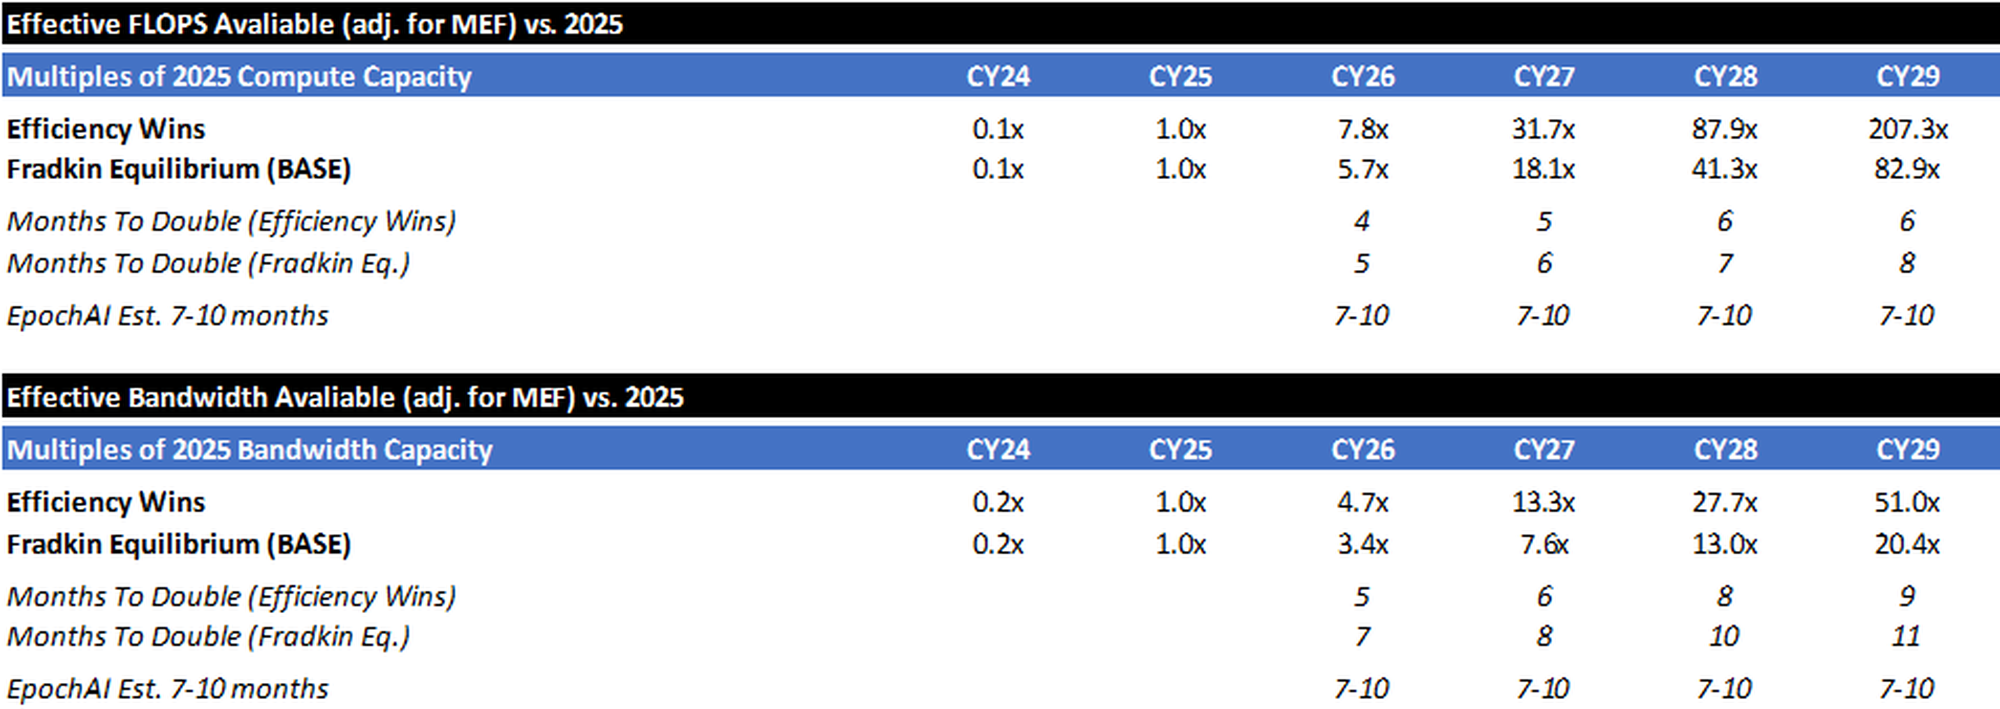
To better illustrate the memory/bandwidth bottleneck, think of a factory: compute is how fast the machines can process parts, and bandwidth is how fast the conveyor belt can deliver raw materials and carry finished goods away. Historically, the machines were the bottleneck – you could feed them faster than they could work. That has flipped. Modern AI accelerators process data so fast that the memory system can't keep up, like a factory floor full of idle machines waiting on a backed-up conveyor belt. This is the "memory wall," and it is why HBM capacity and memory bandwidth per watt are increasingly the binding constraints on inference throughput, not raw FLOPS.
While there may be some ways to increase bandwidth efficiency and “scale the memory wall” (processing-in-memory, prefill/decode disaggregation, model-architecture breakthroughs, etc.), bandwidth will almost certainly be the gating factor (not compute). Even scenarios where technological breakthroughs more than double the amount of bandwidth capacity result in ~50x capacity coming online between now and 2029 (vs. ~80-200x for raw compute capacity).
Supply Side Exercise Summary
To summarize the above exercise, if we take consensus numbers for GWs installed, make aggressive assumptions about Nvidia’s roadmap & the pace of next generation GPU installations, calculate how much raw compute and bandwidth will come online in the coming years, and adjust those raw numbers for a “model efficiency factor” (that takes into account efficiency gains offset by consistent migration to larger models) – we’re likely to see bandwidth capacity (the bottleneck) grow by ~20x-50x between now and 2029.
(Note: As a check, EpochAI estimates that Global AI computing capacity has been doubling every 7-10 months14. The above table shows how each scenario stacks up vs. this baseline.)
Demand vs. Supply
I’d reiterate that my own like-for-like daily compute costs (if calculated using API pricing) have risen at least >10x vs. 2025, and the Yipit panel data indicate that enterprise spend on LLMs has likely risen ~5x over the last year (with a material inflection in late-2025). All of this is happening while I estimate we will only be able to bring on ~3.5x-5.0x effective bandwidth supply this year and ~7.5x-13x bandwidth by the end of 2027.
Now, these aren’t exactly apples-to-apples numbers. Exact translation between tokens/spending and physical infrastructure demand is impossible because (as discussed above) compute requirements depend on model architecture, context length, batching, caching, reasoning overhead, latency targets, and hardware efficiency. Rather than forcing a false precision, the memo compares independent proxies for demand and supply growth. But – if multiple independent demand indicators are growing materially faster than estimated supply, the most reasonable inference is continued tightness in compute availability.
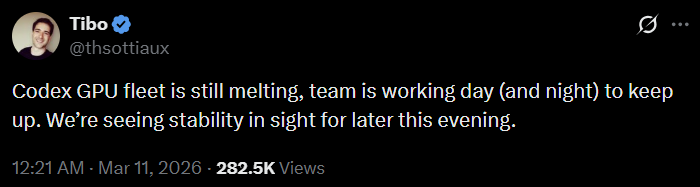
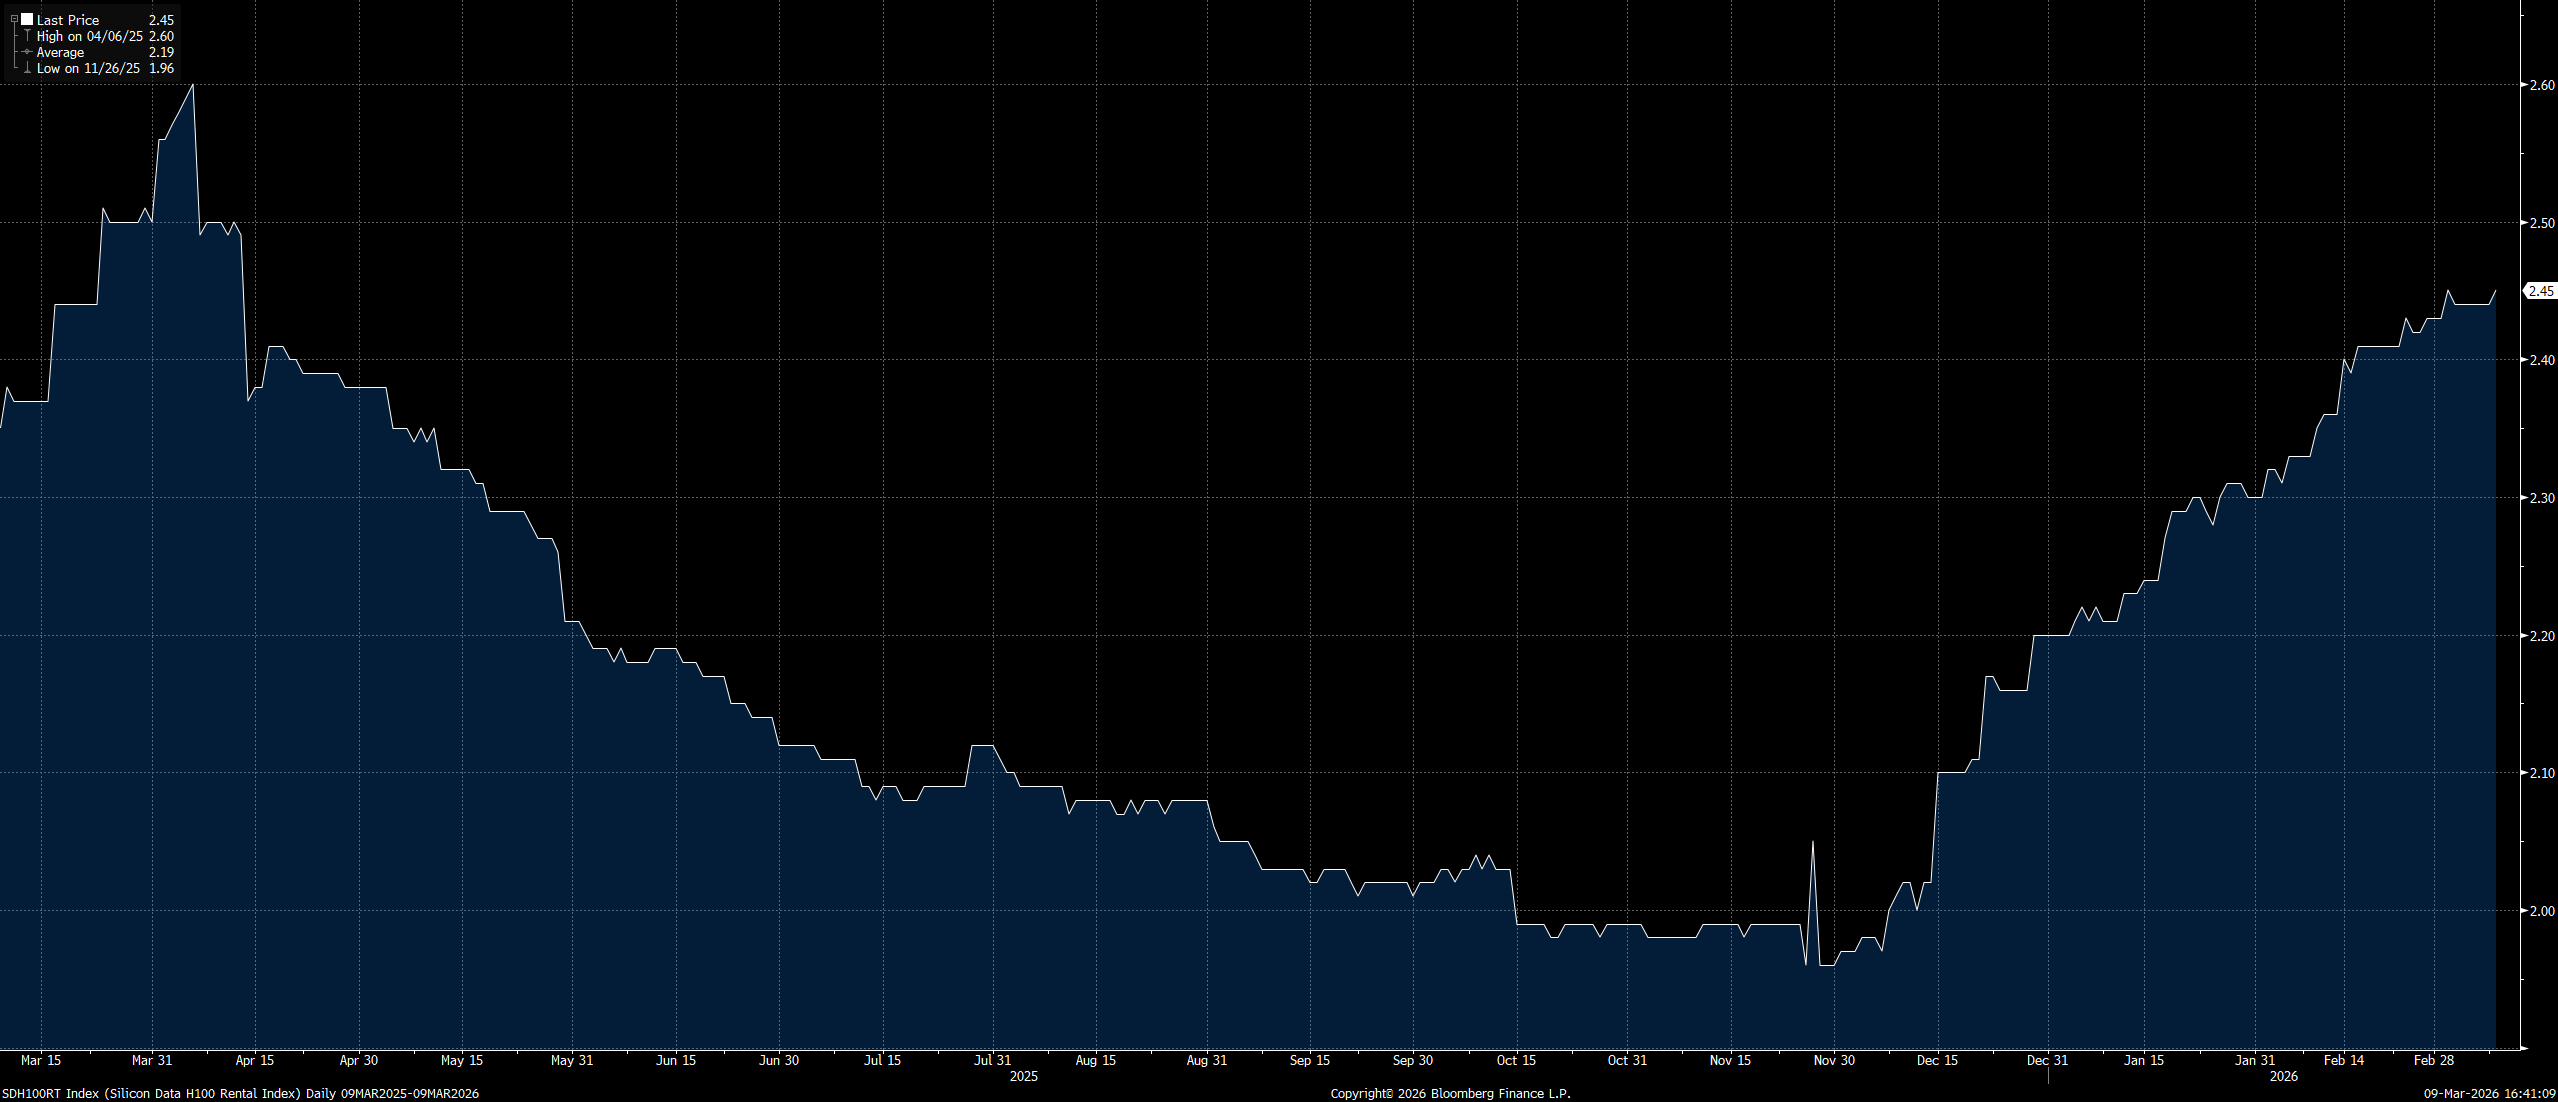
There are tangible signs of this tightness as well. The head of OpenAI’s Codex recently noted that their GPU fleet is “melting” (utilization is so high). H100 rental prices have increased almost 25% since the end of November15, after having dropped 25% in the preceding 6 months. The reason for this is simple: the demand for compute largely exceeds the supply of compute. It is worth noting that the inflection in GPU/hour pricing happened in November (as Claude Code began gaining traction).
Bottlenecks Pose Risk to Buildout Timeline
The preceding analysis sizes supply and demand in terms of effective compute capacity – GW, FLOPS, bandwidth. But these projections assume that consensus capacity additions actually get built. The reality on the ground is far messier, and I think consensus may underappreciate how many things have to break right simultaneously for the buildout to stay on schedule. I think there is material risk to consensus datacenter buildout timelines predicated on various bottlenecks.
Grid Power, Parts, and Skilled Labor
Consensus expects global data center capacity to roughly double this decade – from ~103 GW today to ~200 GW by 203016, with the US alone scaling from ~32 GW to ~95 GW17. That implies ~15-20+ GW of net new capacity per year.
But the gap between "announced" and "operating" is enormous: of the ~16 GW targeting 2026 completion, only ~5 GW is actually under construction — the remaining ~11 GW shows no visible construction progress18. Sightline estimates 30-50% of the 2026 pipeline will slip, consistent with 2025, when 26% of projects expected to come online were delayed.
The grid alone cannot deliver at this pace. Grid interconnection timelines average five years nationally19, with congested ISOs like PJM stretching considerably longer.
The SemiAnalysis team published an instructive comparison: in PJM (13 States), capacity prices jumped 9.3x in the latest BRA auction and 67 million residents now face ~15% household electricity bill increases. In ERCOT (Texas), where an equivalent AI buildout is underway, power futures have barely moved. SemiAnalysis argues that the PJM price spike is primarily a market design and policy failure — not an indication that the grid cannot physically handle datacenter load — but even so, the political consequences are the same… rising popular anger against the buildout. ERCOT's more permissive queue has attracted enormous interest (226 GW of interconnection requests, nearly 4x the level a year ago), but only ~7.5 GW has been approved. Internationally, the timelines are comparable: Tokyo Electric has quoted hyperscalers 5-10 year waits.
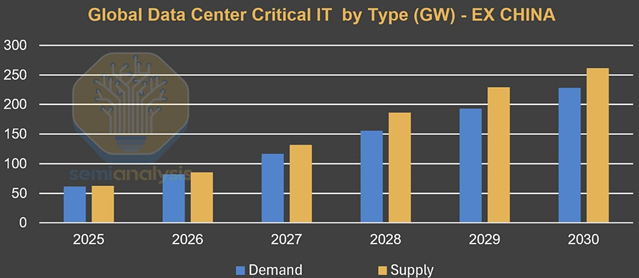
However, the industry is not waiting for the grid. The rise of behind-the-meter generation (primarily onsite natural gas) has alleviated the power constraints. SemiAnalysis predicts global supply (ex-China) staying ahead of demand through 2030, in large part due to BTM's rapid scale-up.
Diesel generator manufacturers, recognizing that their traditional "attach rate" (backup diesel per MW of data center capacity) is declining, are pivoting aggressively into onsite gas, adding over 10 GW of manufacturing capacity to the market. Fuel cells are a complementary path: Bloom Energy has scaled to ~1.4 GW installed across 1,000+ sites, with a $20 billion backlog and production capacity targeting 2 GW/year by end of 2026. Bloom's solid-oxide fuel cells deploy in weeks, require no combustion (easing permitting), and run 10-30% more efficiently than gas turbines – advantages that have attracted partnerships with Brookfield ($5 billion), Oracle, and AEP ($2.65 billion).
Still, ingenuity does not eliminate execution risk. ERCOT data show that campuses already "approved to energize" are not drawing their full allocation – typically because the substation is grid-connected, but the building or racks are not finalized. The constraint is shifting from energy to physical execution. Jefferies, summarizing their recent energy conference, put it bluntly: "EPCs are the new turbines" – there is wide consensus that the binding constraint on delivering US power generation and infrastructure projects is now EPC (engineering, procurement, and construction) capacity and labor, not access to turbines, with many utilities and power developers "not concerned at all about access to power generation equipment for 2H28+." Power transformers still carry lead times of 128-144 weeks and face a 30% supply deficit20, but the bottleneck increasingly sits downstream: the construction industry faces a ~450,000-worker shortage driven specifically by data center growth21, concentrated in the same electricians, ironworkers, and controls technicians needed to commission both the data center and its BTM plant. Where peak crew sizes once reached 750 workers per site, campuses like DataBank's Red Oak are scaling to 4,000-5,000 workers — and these same trades are being pulled simultaneously by grid infrastructure and manufacturing reshoring. Oracle pushed back data centers being built for OpenAI from 2027 to 2028 citing "tight material and labor supply"22. The supply response is real, and the industry's ingenuity in scaling BTM is genuinely impressive — but delivering ~15-20 GW of net new capacity per year globally remains an unprecedented construction challenge, and the track record so far suggests meaningful slippage is the norm, not the exception.
Policy and Local Opposition
This may be the most underappreciated bottleneck. $64 billion of data center projects have been blocked or delayed by community opposition23. Communities in at least 14 states have enacted temporary pauses24 on data center development. Michigan introduced bipartisan legislation to freeze all data center approvals through April 202725. New York's S.9144 (February 2026) would halt permits for facilities exceeding 20 MW for three or more years26. Oracle and OpenAI's $7 billion Saline Township data center was initially denied rezoning by the township board in September 2025 (the project subsequently proceeded via settlement)27. Residents are pushing back on noise, water consumption, electricity costs, and what they perceive as Big Tech extracting local resources for private gain. This likely prompts an increased push toward contracts that ring-fence data center buildouts from impacting broader customer affordability and reliability – but even ring-fencing takes time to negotiate and implement, and in the meantime, projects are stalling.
CoWoS, HBM, and Wafer Supply
Even if the power, labor, equipment, and permits materialize, silicon continues to act as a governor. TSMC's CoWoS advanced packaging is sold out through 2026, with demand running ~3x available supply per TSMC management. Nvidia has secured over 60% of total CoWoS capacity, leaving AMD, Google, Amazon, and everyone else competing for the remaining ~40%. CoWoS capacity is scaling from ~35K wafers/month at end 2024 to ~120-130K by end 2026 and ~150K targeted for 202728 – but each new GPU generation consumes more packaging area (Rubin Ultra uses a 4x reticle29, requiring ~33% more wafers per chip just to maintain unit throughput).
TSMC's management philosophy compounds the constraint. CEO C.C. Wei has been explicit that TSMC will not overbuild, referencing the 2021-2022 cycle – when pandemic-era demand surges led TSMC to ramp capacity aggressively, only for orders to collapse and utilization to drop well below targets — as a cautionary tale: "I put wording of discipline. That means we are not going to repeat the same kind of mistake that we have in 2021, 2022." He has repeated across multiple earnings calls that TSMC "employs a disciplined and thorough capacity planning system," adding that this is "especially important when we have such high forecasted demand from AI-related business" – in other words, boom cycles are precisely when TSMC tightens its grip, not when it loosens it. At the SIA Awards in November 2025, Wei described the gap between customer demand plans and available advanced-node capacity as roughly 3x, joking that he wanted to wear a T-shirt reading "No more wafers." And yet, when discussing TSMC's $52-56 billion capex plan, Wei called the risk of misallocation "a big disaster for TSMC for sure." Customers must prepay to reserve capacity — Nvidia and others deposited NT$291 billion (~$9 billion) in 2024 alone — and TSMC applies this selectively, creating a negotiated queue rather than guaranteed supply. The result: the Big 4 hyperscalers collectively outspend TSMC on capex by roughly 12-to-1 ($624 billion vs. $54 billion), but TSMC dictates the pace.
HBM is an equally binding constraint, and one that compounds with CoWoS. High Bandwidth Memory is produced by just three firms — SK Hynix (~57% share), Samsung (~22%), and Micron (~21%) – and all three are sold out through 2026. The supply-demand mismatch is structural: each successive GPU generation demands dramatically more HBM per chip. The H100 used 80 GB across five 8-Hi stacks; the B200 requires 192 GB across eight stacks; the B300 steps to 288 GB using 12-Hi stacks; and Rubin Ultra will require over a terabyte across sixteen 16-Hi stacks —roughly 12x the HBM content of the H100. Meanwhile, Samsung — the world's largest memory manufacturer — repeatedly failed Nvidia's HBM3E qualification tests throughout 2024 and into mid-2025, with failures rooted in heat dissipation and power consumption. Samsung did not clear Nvidia's 12-Hi validation until September 2025, effectively ceding 18 months of supply to SK Hynix and Micron. HBM is also extraordinarily difficult to manufacture: each stack requires thousands of through-silicon vias drilled at micron-scale precision, with yield rates historically running 40-60% versus 90%+ for standard DRAM – and a defect on any single layer fails the entire stack. SK Hynix is investing over $32 billion in new fab and packaging capacity, and Samsung and Micron are ramping aggressively, but even with these expansions, Micron acknowledges it can currently meet only 55-60% of core customer demand. HBM prices — already at a steep premium to commodity DRAM (1 GB of HBM consumes ~4x the wafer area of standard DRAM) – rose ~20% for 2026 contracts. Because HBM and CoWoS are independent, parallel constraints – a finished GPU ships only when both are available – loosening one does not proportionally increase output unless the other is simultaneously loosened. Nvidia has acknowledged that "ongoing limitations in component supply, such as HBM memory, pose short-term challenges for Blackwell production."
Beneficiaries and Crowding-out in a Compute-short World
The preceding sections establish that token consumption is growing super-linearly while physical constraints -- watts, labor, wafers, bandwidth -- prevent supply from keeping pace. This shortage is structural and will likely persist for years. What follows is an assessment of who benefits and who is disadvantaged.
Foundry and Advanced Packaging
TSMC is the single most critical node. Every major AI accelerator – Nvidia, AMD, Broadcom’s custom XPUs, hyperscaler silicon – flows through TSMC’s fabs. CoWoS is sold out through 2026. All 2nm capacity for 2026 is booked. Wafer demand runs ~3x available supply. TSMC’s disciplined capacity expansion elongates the cycle and ensures high utilization and pricing power for years. In a compute-short world, the company that controls wafer allocation controls the pace of the entire buildout and should earn monopolistic rent.
Memory
HBM is the other binding silicon constraint. Capacity is concentrated among three suppliers (SK Hynix, Samsung, Micron), the production process is technically demanding, and each successive accelerator generation demands dramatically more HBM per chip. Bandwidth scales slower than compute, which means memory throughput is increasingly the real constraint on token output. HBM pricing power likely persists through at least 2027.
Semiconductor Capital Equipment
If TSMC is the bottleneck, semicap is the bottleneck to the bottleneck. Expanding advanced-node wafer capacity, CoWoS packaging, and HBM capacity requires EUV lithography (and soon high-NA EUV), deposition, etch, inspection, and packaging equipment — all with multi-quarter to multi-year lead times. As long as the world is short wafers, TSMC and its peers must keep buying tools. ASML, Applied Materials, Lam Research, KLA, and Tokyo Electron all benefit from both volume and complexity-per-wafer. This is a sustained upcycle less sensitive to end-market cyclicality than prior semiconductor capex waves.
Power Infrastructure
Every GW of AI compute requires power generation, transmission, and cooling. The infrastructure to deliver it is years behind demand. Companies providing grid connections, on-site generation (natural gas, nuclear, fuel cells), electrical equipment, and cooling solutions will continue to benefit, particularly those that are able to enable BTM solutions in light of an overwhelmed grid.
Hyperscalers That Can Coordinate the Full Stack
The buildout requires simultaneous coordination across power, construction, chip allocation, and customer demand. A GPU waiting for power is a dead asset. A powered facility waiting for chips earns nothing. The entities that have pre-solved multiple constraints — secured power purchase agreements or behind-the-meter generation, locked TSMC and HBM allocations years in advance, commissioned (and successfully financed) the physical infrastructure, and have inference demand from their first-party platforms and cloud customers — can convert capex to revenue as soon as silicon arrives. This allows the hyperscalers to achieve high silicon utilization & attractive per-hour GPU (or custom-silicon) pricing from day one.
This also creates a self-reinforcing dynamic. High utilization and per-hour pricing produce high ROICs, funding (and justifying) the next round of capital commitment, which in turn secures the next tranche of power and chip allocation.
AI Accelerator Suppliers
Demand for AI accelerators broadly exceeds supply, and this benefits the full range of suppliers. Nvidia dominates training and remains the default platform for most inference workloads. But the ecosystem is broadening faster than consensus appreciated even six months ago: Broadcom now projects AI chip revenue potentially exceeding $100B by 2027 and is designing custom XPUs for multiple hyperscalers. OpenAI has signed major compute agreements with both Cerebras and AMD. Nvidia itself has licensed Groq’s inference technology. Anthropic has scaled to $20B of ARR largely on the back of Trainium and TPUs.
The competitive dynamics among accelerator suppliers are evolving rapidly, and trying to pick winners and losers within this layer is a lower-confidence exercise than identifying winners at the foundry, memory, equipment, and hyperscale layers, where concentration is higher and competitive positions are more durable.
The more defensible observation is that total accelerator demand exceeds total accelerator supply, and this benefits all credible suppliers to varying degrees.
Who Bears the Cost
The clearest losers are not within the AI supply chain — they are adjacent to it. Non-AI consumers of advanced semiconductors face crowding-out on two fronts.
First, memory: as DRAM manufacturers convert production lines from commodity DDR5 to HBM, conventional memory buyers — smartphone OEMs, PC makers, automotive chip suppliers — face tighter supply and rising costs.
Second, advanced packaging: any company competing for CoWoS or comparable packaging capacity (for high-performance computing, networking, or consumer SoCs) is being deprioritized relative to AI accelerator customers willing to prepay at premium pricing.
Enterprises who’d like to try on-prem AI solutions are the other clear losers. Delayed deployments, rationed capacity, long procurement cycles, and high prices all encourage enterprises to provision LLM capacity through cloud service provider or frontier lab partners.
How I Could Be Wrong
Despite the strong evidence of tightening AI infrastructure markets, several developments could materially weaken the bottleneck thesis.
Model efficiency improves faster than expected
Rapid improvements in model architecture, inference optimization, and software efficiency could dramatically reduce compute requirements per task. Techniques such as mixture-of-experts routing, speculative decoding, quantization, and improved context management may significantly reduce the number of effective tokens required for a given workload. If efficiency improvements outpace demand growth, compute supply could catch up faster than anticipated. While over an extended period of time I would expect Jevons’ paradox to come into effect, a discontinuous architectural breakthrough could result in a period of oversupply.
Smaller models capture a larger share of workloads
Many real-world applications may not require frontier models. Distilled or domain-specific models could perform adequately for large portions of enterprise and consumer workloads. If inference shifts toward smaller models, particularly ones that can be hosted on-device, aggregate AI datacenter related compute demand could grow more slowly than expected.
Custom silicon expands supply faster than modeled
Hyperscalers are aggressively developing custom inference silicon (e.g., TPUs, Trainium, Maia, MTIA). If these architectures scale effectively and materially reduce cost per inference, effective supply could expand significantly beyond Nvidia-based projections. I’ve attempted to control for this by assuming (i) the upper-end of the rumored range for compute and bandwidth efficiency for Nvidia’s next generation chips and (ii) an aggressive roll-out of said chips.
Infrastructure deployment accelerates
The memo assumes meaningful friction in power infrastructure, grid interconnection, transformer manufacturing, and datacenter construction. If these bottlenecks resolve faster than expected, datacenter capacity could scale more quickly than modeled.
Demand monetization disappoints
While AI usage metrics appear extremely strong, it remains possible that monetization lags infrastructure deployment. If enterprises adopt AI more slowly than expected, demand growth could slow materially.
Sources
- illuminem, "The Cost of Context: The Exponential Growth in Tokens."
- OpenRouter/a16z, "State of AI: 100T Token Study," 2025.
- OpenAI, "The State of Enterprise AI 2025."
- The cleanest narrow proxy is high-skill occupations: managers, professionals, and technicians/associate professionals under ISCO/ILO definitions
- OpenAI API Pricing, openai.com/api/pricing.
- Anthropic API Pricing, anthropic.com/pricing.
- Yipit, "Weekly AI API Spend Tracker," panel data, 2025-2026.
- Bloomberg, "Anthropic Nears $20 Billion Revenue Run Rate," March 3, 2026.
- Reuters, October 2025; Bloomberg, "Anthropic Revenue Run Rate Tops $9 Billion," January 21, 2026.
- SaaStr, "Anthropic Just Hit $14 Billion in ARR," February 2026; Bloomberg/Yahoo Finance.
- Bloomberg, "Anthropic Nears $20 Billion Revenue Run Rate," March 3, 2026.
- SaaStr; The Information. Multiple outlets confirmed ~$1B ARR as of late 2024.
- Fradkin et al., "The Rise and Fall of AI Pricing," NBER Working Paper, 2025. Uses OpenRouter transaction data.
- Epoch AI, "AI Chip Production," epoch.ai/data-insights/ai-chip-production. Doubling time 7 months (90% CI: 6-8 months), measured since 2022.
- Silicon Data, "H100 Rental Price Over Time," silicondata.com.
- JLL, "Global Data Center Outlook," 2026.
- Goldman Sachs GS SUSTAIN, "AI/Data Center Power Demand: How Rising Hyperscaler Reinvestment Impacts the 6 Ps Driving Power Growth & Constraints," February 23, 2026.
- Sightline Climate, "US Data Center Construction Tracker," 2026.
- Lawrence Berkeley National Laboratory (LBNL), "Queued Up: Characteristics of Power Plants Seeking Transmission Interconnection," 2024.
- Wood Mackenzie, "Power Transformer Market Outlook," 2025.
- Information Technology and Innovation Foundation (ITIF), "The Data Center Workforce Challenge," January 2026.
- Bloomberg, "Oracle Delays OpenAI Data Centers Citing Material and Labor Constraints," December 2025.
- Data Center Watch, "Community Opposition Tracker," 2026.
- TechPolicy.Press, "The Real Race for an AI Moratorium," December 2025; Good Jobs First, "Data Center Moratorium Bills Are Spreading in 2026."
- Michigan HB 5594-5596 (Reps. Wortz, Fox, Wegela), introduced February 26, 2026. Michigan Advance, February 2026.
- NY Senate Bill S.9144 (Sens. Krueger, Gonzalez; Asm. Kelles), introduced February 6, 2026. DLA Piper, February 2026.
- Planet Detroit, September-October 2025; settlement approved and intervention denied, February 2026.
- TrendForce, "TSMC Set to Expand CoWoS Capacity to Record 75,000 Wafers in 2025," January 2, 2025; TSMC management guidance.
- SemiAnalysis, "Vera Rubin: Extreme Co-Design." Standard Rubin (R200) uses 2 reticle-sized compute dies; Rubin Ultra uses 4.
Nothing here is investment, legal, tax, or financial advice. It’s opinion for educational purposes only—not a recommendation to buy or sell any security. I may hold positions in securities mentioned and may change them at any time without notice. All discussion regarding investments is in sole reference to my personal investment accounts. Any discussion of performance refers solely to my personal investment accounts, is unaudited and incomplete, and is provided for illustration only. It is not marketing, advertising, or a solicitation for any advisory service, fund, or security. Past performance is not indicative of future results. Do your own research.